By Bill DeBaun, Director of Data and Evaluation, and Carrie Warick, Director of Policy and Advocacy
In 37 states, the average Free Application for Federal Student Aid (FAFSA) completion rate in higher-income school districts surpasses that of lower-income school districts. This suggests students who are most likely to benefit from access to postsecondary
financial aid are less likely to get it. On average, the gap in FAFSA completion between higher- and lower-income school districts is more than 7 percentage points.
This finding comes from a new National College Access Network (NCAN) analysis, national in scope, which measures FAFSA completion according to the percentile of student poverty into which school districts fall. The analysis, reported at the state level,
points to both inequitable FAFSA completion rates according to income within states and differences between states in terms of absolute FAFSA completion performance. Danielle Lowry, a doctoral candidate at the University of Pittsburgh Learning Research
and Development Center, conducted the analysis.
Visit NCAN’s interactive online dashboard to further explore this
new analysis on district-level FAFSA completion rates by poverty percentile. Here users can explore trends both within and across states, compare states by overall and equitable FAFSA completion, and access more resources from NCAN’s Form Your Future campaign, focused on boosting FAFSA completion rates.
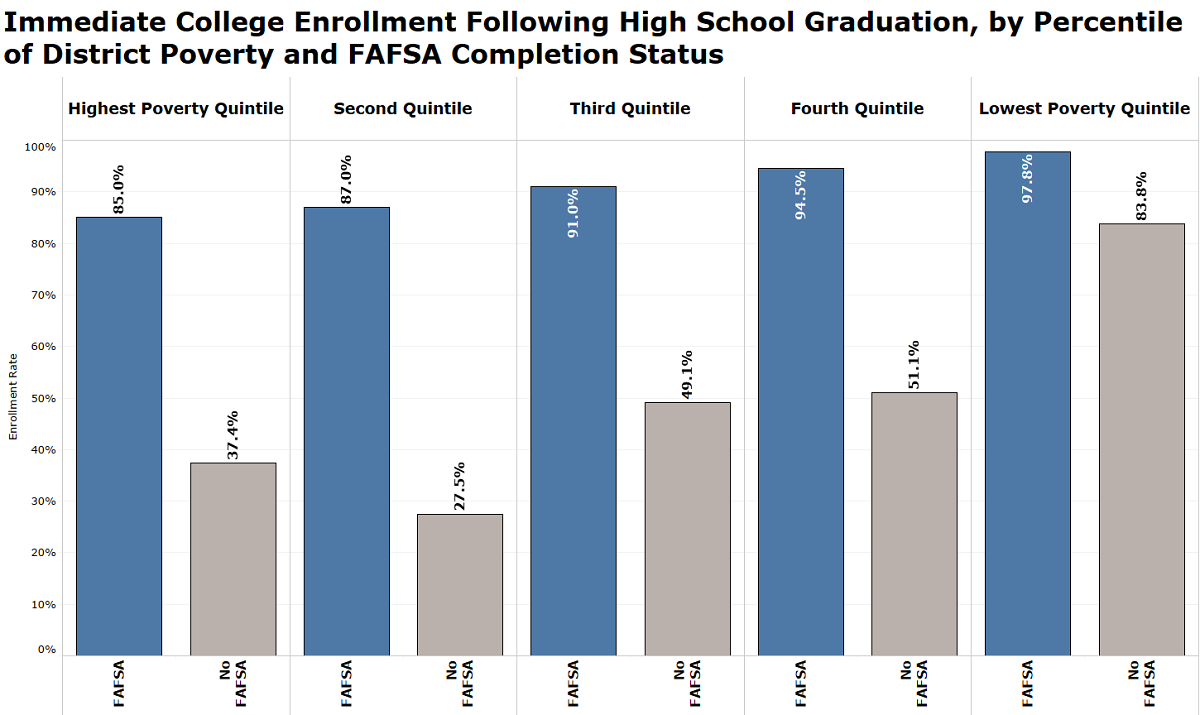
FAFSA completion is associated with an increased likelihood of immediately enrolling in postsecondary education
after high school graduation. Nationally, students in the lowest income quintile who completed a FAFSA were 127% more likely to immediately enroll than those who did not complete a FAFSA. (See Figure 1.)
Figure 1.
Lowry conducted a statistical analysis that examined the relationship between the district-level FAFSA completion rate for the class of 2019 and the percentage of students aged 5 to 17 in the district who were living in poverty. Lowry then used state-level
regressions to predict the average district-level FAFSA completion rate for each state by the 10th, 25th, 50th, 75th, and 90th percentiles of the national distribution of district-level child poverty.
Figure 2 shows a clear upward trend in FAFSA completion rates by district poverty percentile, although some outliers exist. Each circle represents both a state and the average FAFSA completion rate of school districts at the given poverty percentile.
Moving left to right from higher-poverty school districts to lower-poverty school districts, it is clear that FAFSA completion rises.
Figure 2.
That FAFSA completion behaviors differ according to income levels is not a new finding, but its continued existence is frustrating all the same. The results discussed here are similar to a report released in October 2018 that considered the relationship between district poverty and FAFSA completion from 2016 to 2018. Beyond that, FAFSA completion initiatives remain a major focus for NCAN members across the country.
A report from NerdWallet estimated that by not completing the FAFSA, 600,000 members of the high school graduating class of 2018 missed out on about $2.6 billion in federal
grants that could have made postsecondary education more affordable.
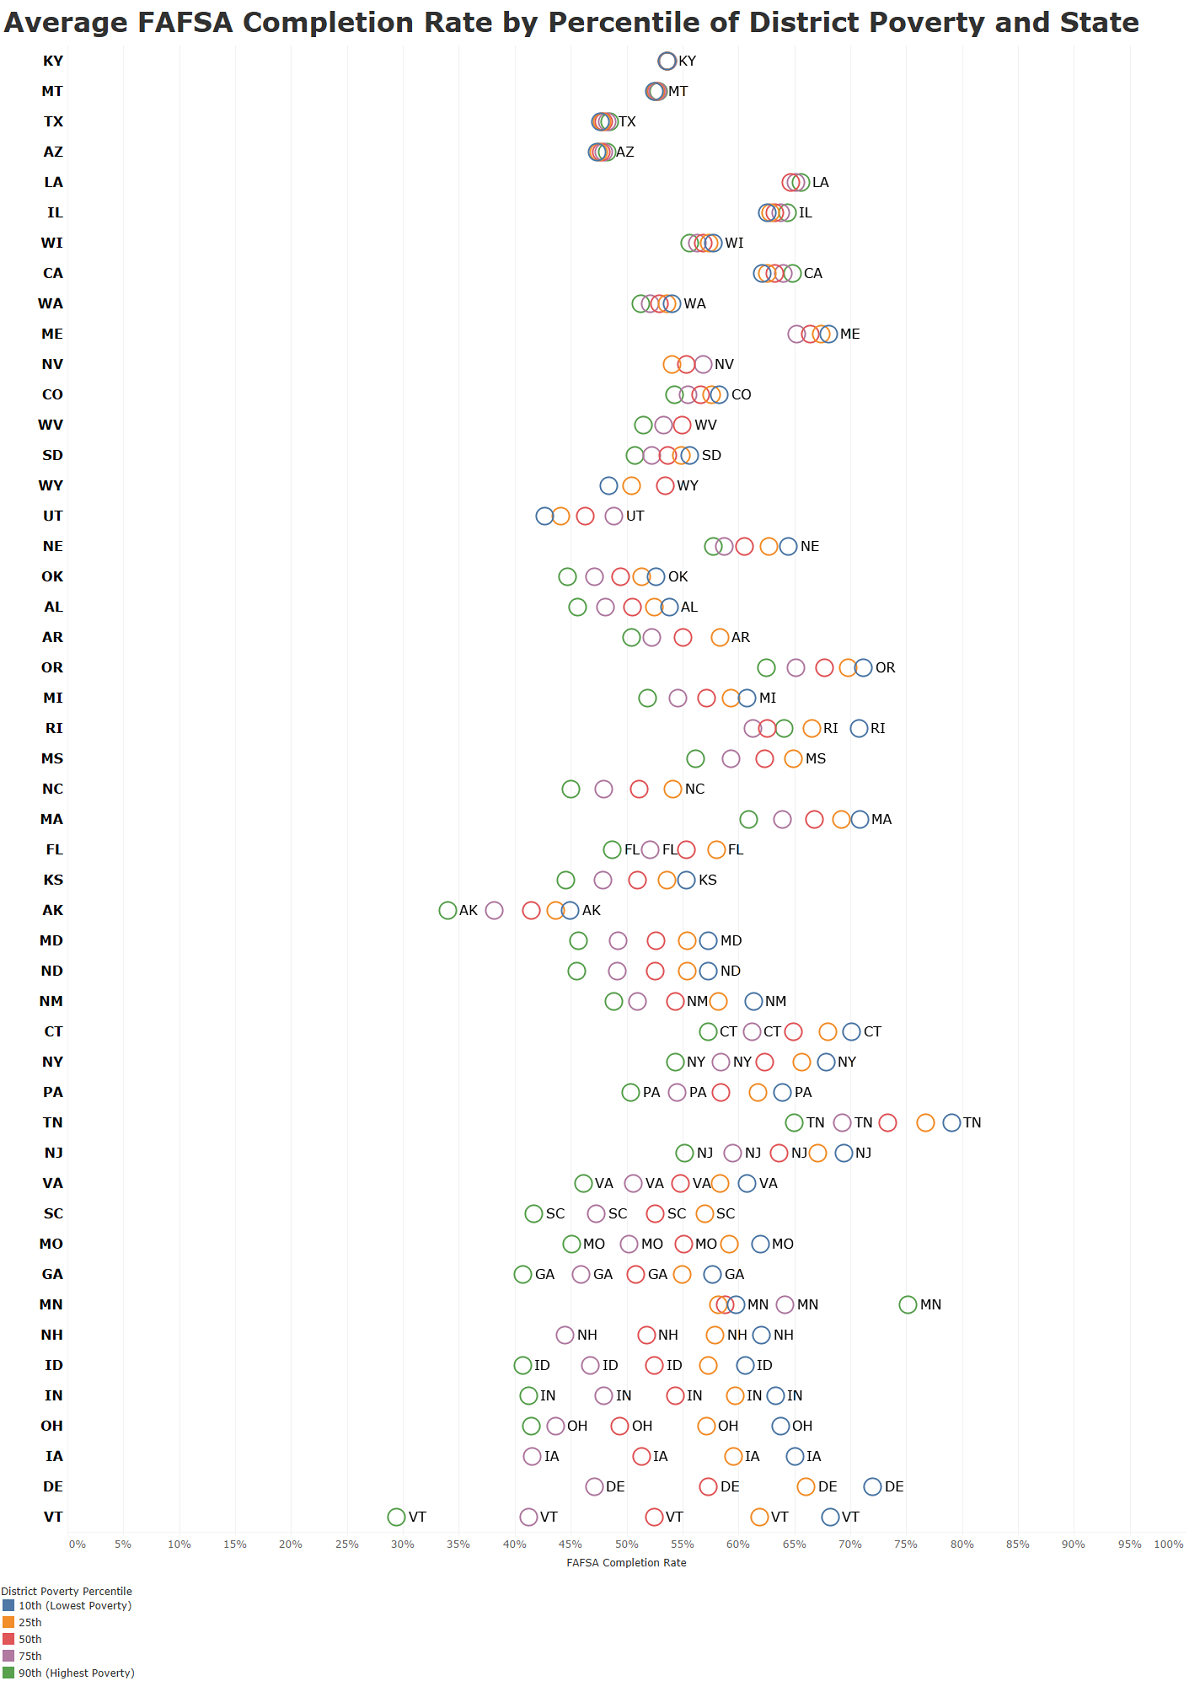
FAFSA completion behaviors among the states are not monolithic. Figure 3 below shows that in some states (e.g., Kentucky, Montana, Texas, Arizona), FAFSA completion is about the same across school districts regardless of poverty percentile (this is where
the circles, each representing districts at a given poverty percentile, are closely grouped). On the other end of the spectrum (where the circles are far apart from each other), FAFSA completion varies widely in states like Vermont, Delaware, Iowa,
and Ohio, in which there is a percentage point difference of between 13 and 21 points in FAFSA completion between districts at the 25th and 75th percentiles of poverty. The full table appears at the end of this post.
Figure 3.
Equitable FAFSA completion rates are critical, but so is a state’s absolute performance in getting students to complete the FAFSA. Figure 4 below shows states on two axes: the percentage point difference in FAFSA completion rates between schools at the
25th and 75th percentiles of district poverty, and the FAFSA completion rate of districts at the 50th percentile. The further to the top and right of Figure 4 a state is, the better it performs according to both measures. Minnesota, California, Illinois,
Maine, and Kentucky fare notably well here.
Figure 4
For years NCAN has emphasized the importance of FAFSA completion and examined how to increase it through both policy and practice.
From the policy standpoint, NCAN encourages policymakers to #FixFAFSA through simplification by implementing a streamlined FAFSA that was developed with member support and after carefully researching the most efficient ways for the most users to complete the form. User testing showed an increase in satisfaction and usability for families,
an improvement in completion time by 3%, and a 56% error rate reduction across all three pathways of this proposed model.
NCAN has also pushed for improvements to the FAFSA verification process, which unintentionally and quietly wreaks havoc on financial aid applicants, particularly students from low-income backgrounds. While the federal government flags about 30% of all
aid applicants for verification, it selects roughly half of all applicants who are low-income. And students from low-income backgrounds are frequently stymied by the verification process. Some obstacles include obtaining and completing different forms
if they are applying to multiple schools, long waits for mailed IRS documents, and painful visits to records offices for death certificates. These barriers lead to "verification melt," or a failure to complete the verification process that derails a student’s receipt of a Pell Grant and other financial aid. Only 56% of Pell-eligible students selected for verification actually complete this
review process and go on to receive a Pell Grant. In comparison, among Pell-eligible students not selected for verification, 81% ultimately receive a Pell Grant. This represents a 25 percentage-point “melt.”
On the practice side, NCAN leads Form Your Future, a national campaign to increase FAFSA completion. The Form Your Future website includes an easy-to-follow guide for filling out the form, links to resources
by state, and a FAFSA Tracker that allows users to view completions at the national, state, city, district, and school levels across the entire FAFSA cycle. Additionally, NCAN facilitated two FAFSA Completion Challenges,
friendly competitions between cities to see who could raise their FAFSA completion rates the most. Important insights about community-wide completion campaigns came out of these challenges.
NCAN will continue to advocate for and educate about FAFSA completion in the hopes that more students learn about and access critical financial aid. Although FAFSA completion is just one step on the pathway to postsecondary education, it is an important
one, and this new analysis shows that those who stand to benefit the most are unfortunately too often least likely to complete.
Notes:
Hawaii and the District of Columbia are omitted from this analysis because each has only school district.
Where cells are blank, the state did not have enough school districts at that percentile of national childhood poverty to analyze.


