Charts are really useful. They can illuminate, clarify, and put into context realities that we miss by communicating the same facts via text. The college access and success field uses data visualization to great effect on a daily basis.
David Roberts over at Vox recently offered up “What’s causing climate change, in 10 charts.” His article examines the
sources and amounts of emissions over time. Climate change, like college access, is a complicated topic with many different interrelated and interlocking parts. Seeing the Vox article, it seemed likely that a similar exercise could be useful for examining
the sources of persistent inequities in college access.
As Roberts notes in his article, “None of this data is original — it’s all public — but putting these charts in one place can help us wrap our minds around the many different ways that questions about responsibility for climate change can be phrased.”
Sub “college access” for “climate change” here and it still holds true.
Away we go!
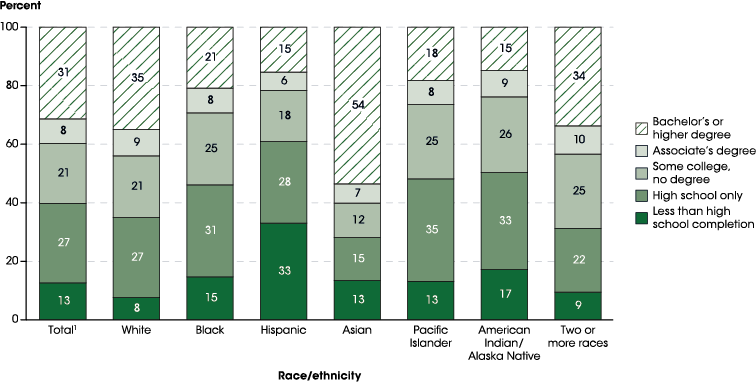
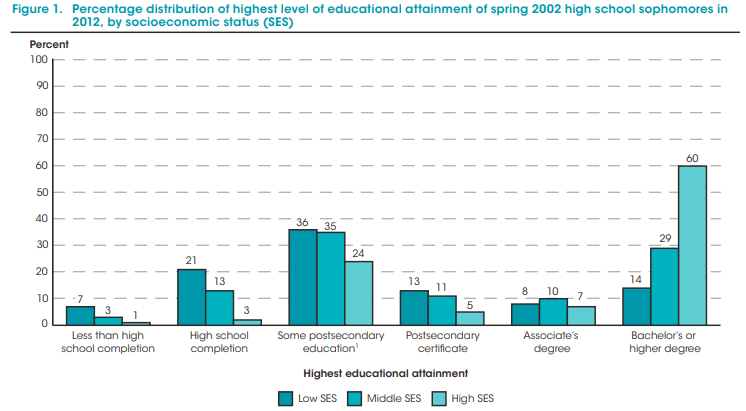
Start here: there are significant gaps in educational attainment by income, race, and ethnicity. There are a lot of ways to show this; here are two clear views.
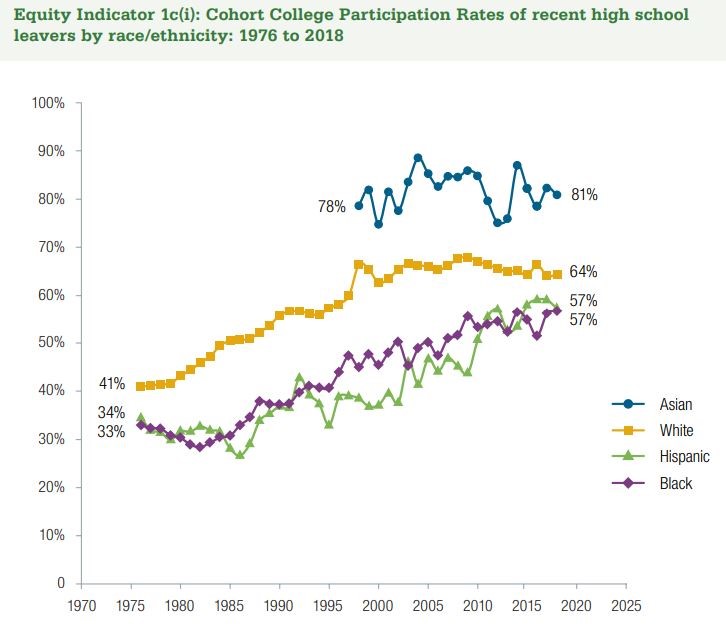
Gaps in college participation rates have narrowed over time, especially for Hispanic students, but significant disparities still exist.
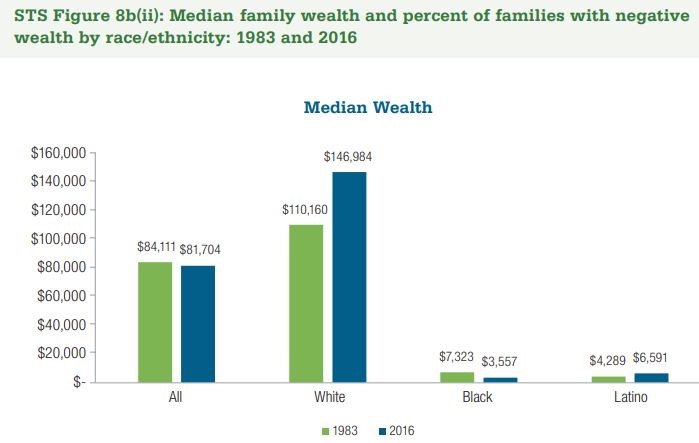
Wealth accumulation for Black and Hispanic families remains difficult, and 37% and 33%, respectively, of these families had negative amounts of wealth in 2016.
There are at least two big reasons that wealth and educational attainment matter so much for college access:
College is expensive.
College knowledge (knowing how to get on and stay on a postsecondary pathway and navigate the college-going process) matters a lot.
“College is expensive” is hardly groundbreaking analysis, but let’s put it in context.
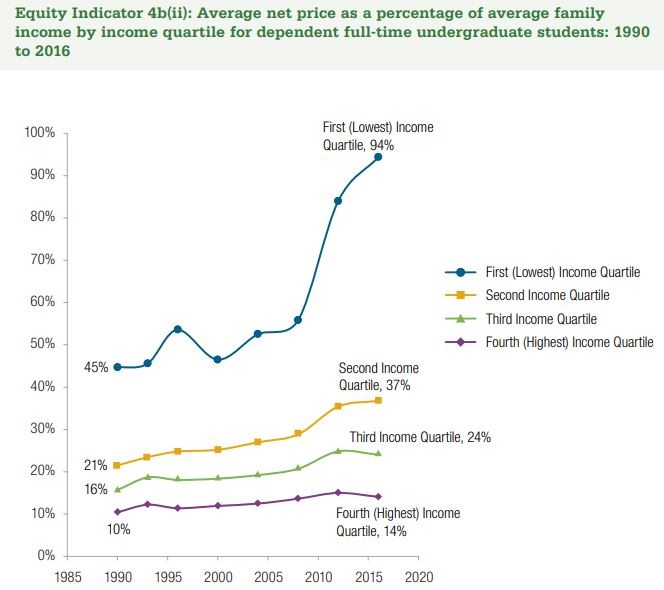
College is getting more expensive, often for those who can least afford it. In 2016, the average net price to attend full-time undergraduate education was 94%(!!!) of the income of a family in the lowest income quartile. For the next highest income quartile
it was still 37%.
The percentage of affordable four-year public institutions nationally decreased from 35% to 25% and affordability gaps grew from $1,212 to $2,406.
For two-year public institutions (community colleges), the decrease in the percentage of affordable institutions went from 52% to 45% and the gap rose from $132 to $640.
NCAN’s affordability formula is based around the average Pell Grant recipient and accounts for federal, state, and institutional grant aid and federal loans. It also assumes that students can put gross proceeds from the average Federal Work Study award,
their Expected Family Contribution, and gross summer earnings from a minimum wage job toward the total price. Those are very generous assumptions! This means that the affordability picture described above is actually pretty conservative and likely
affordability is even worse.
College affordability is definitely a multipronged problem. Asking 10 analysts about its root cause will likely yield distinct 10 responses. But one reason many of those analysts might identify is that public policy hasn’t kept up with making postsecondary
education affordable.
For example, the Pell Grant, the federal government’s premier college access policy and the cornerstone of financial aid packages nationwide, hasn’t kept up with college costs.
To have kept up with two-thirds of the cost of college, the maximum Pell Grant would have to increase by about 170% (to $16,484 in the 2018-19 academic year). This is why NCAN has been such a vocal proponent of doubling Pell.
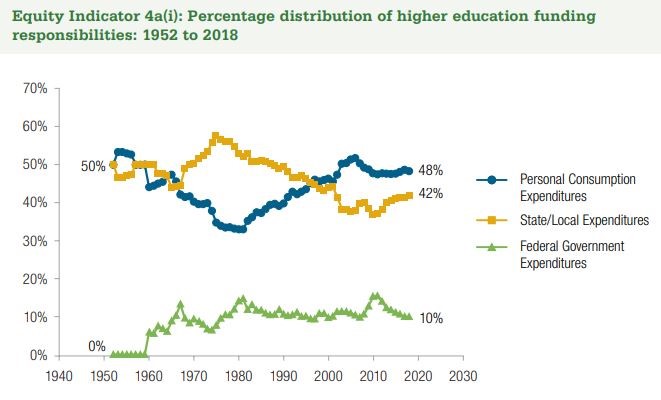
But it’s not just the Pell Grant. State-level divestments in funding postsecondary education have shifted more and more of the cost of college onto students and families.
Editorializing here for a moment, the point at which that yellow line went beneath the blue one is when states started getting short-sighted about the long-run benefits of increasing access to postsecondary education. Sure, states will point to all kinds
of reasons for why they needed to do it. Some of them are even sensible! In the wake of the Great Recession and other fiscal demands, the higher education system always seemed a place that looked ripe for trimming. But a system that consistently produces
a well-educated population is also important for economic development, tax revenues, etc., to say nothing of other benefits like improved health, public safety, and civic outcomes.
All of the college access inequities can’t be chalked up to the cost. College-going is a multi-step process, and it’s a pathway that many students get set up on from an early age. Having a trusted guide throughout the process in the form of a family member
seems to make a big difference. Recall the earlier chart about parent educational attainment.
The chart below shows that students with college-educated parents were more likely to believe a four-year degree was necessary for success, to be encouraged to pursue an education-related postsecondary pathway (i.e., degree or credential), to actually
do so, to finish, and to have received at least a college degree themselves.
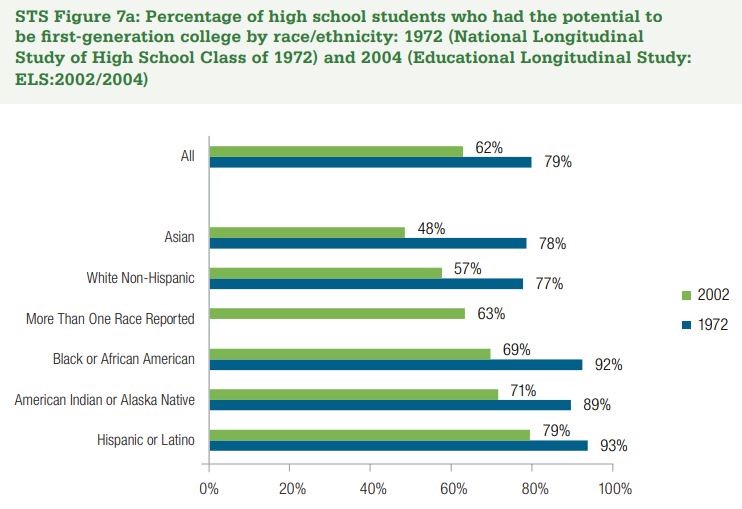
Disparate historical participation in and completion of postsecondary pathways across racial and ethnic groups also means that Black, Hispanic, and Native students are much more likely to be first-generation than their Asian or White peers.
That means that systematically Black, Hispanic or Latino, and Native students face more barriers related to college knowledge and encouragement than their peers, on average. Given what we know about wealth accumulation by race and ethnicity, there is
a double jeopardy here.
There are many, many, many places in the system where wealth and college knowledge intersect.
A discrete one that NCAN has examined closely is around completion of the Free Application for Federal Student Aid (FAFSA). The FAFSA is the gateway to receiving federal financial aid and is a key milestone in the college-going process, a key signal of
postsecondary intention, and a key leading indicator of postsecondary enrollment. This is especially true for students from low-income backgrounds. K-12 districts and the
community organizations they partner with (or work in parallel to) closely follow this metric.
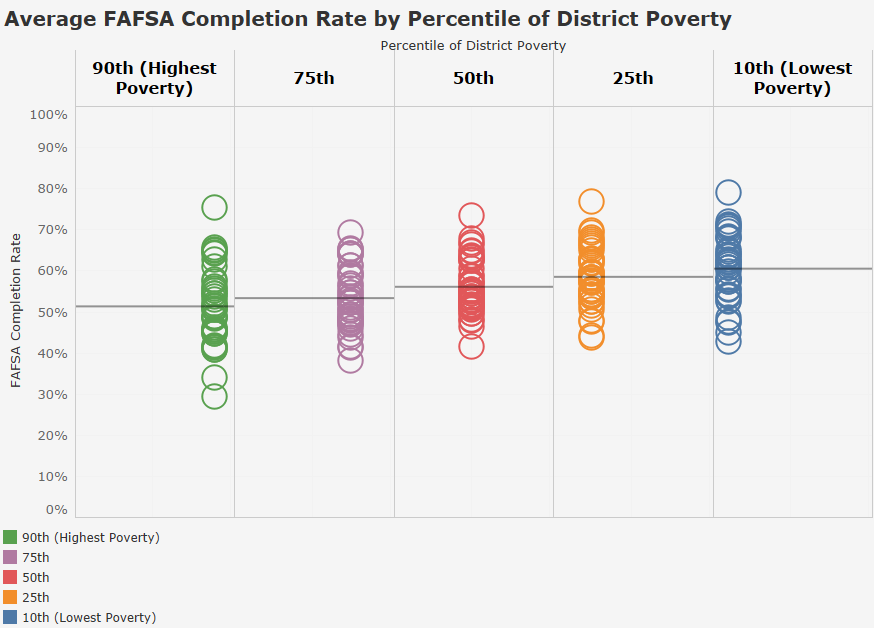
In 37 states, the average Free Application for Federal Student Aid (FAFSA) completion rate in higher-income school districts surpasses that of lower-income school districts. This suggests students who are most likely to benefit from access to postsecondary
financial aid are less likely to get it. On average, the gap in FAFSA completion between higher- and lower-income school districts is more than 7 percentage points.
Incidentally, these districts also seem likely to be the place where students are not getting all of the postsecondary advising supports that they need, and those supports are what would make up for college knowledge that students don’t have. A deeper
dive into the lack of access to sufficient postsecondary advising supports will have to wait another day. Suffice it to say for now that NCAN member programs across the country work hard every day to provide those supports and fill in those knowledge
gaps.
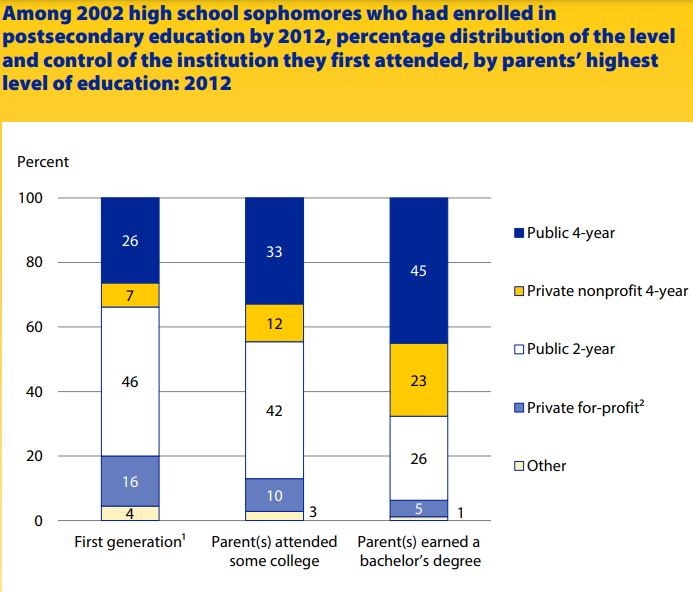
Switching gears, and not to say that completing or not completing the FAFSA determines the type of institution you attend, it’s worth looking at how first-generation status does appear to associate with that important decision.
The chart below shows that first-generation students were much more likely to attend a community college or for-profit institution and much less likely to attend a four-year, private nonprofit institution compared to students whose parent(s) had at least
a bachelor’s degree.
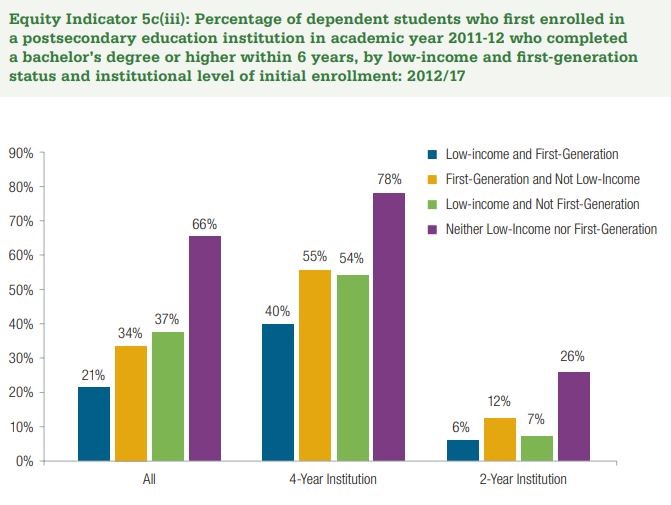
This isn’t to say anything malign about community colleges. They are the workhorse of the American higher education system, and they deserve more funding than we currently give them. But their completion rates are not as high as their four-year counterparts. That’s for all kinds of reasons, and it’s worth considering those. But as a jumping off point for bachelor’s degree completion, specifically, the next chart shows that starting at a two-year institution leads to that outcome much less often, and especially so for students
from low-income backgrounds, first-generation students, and those from both categories.
The reasons for gaps in completion rates and the interventions in the field that appear to close them are another topic for another day, but unfortunately those gaps also very much exist based on economic background and between students of different racial and ethnic groups.
Rather than end on a sour note, of which there have been plenty in the grueling slog that has been the 2020 experience, let’s strike a more hopeful tone. Yes, it is true that gaps in wealth and educational attainment have been key drivers of the college
access gaps that are so clear today. No, a lack of access to a postsecondary pathway is not a foregone conclusion for students from low-income backgrounds, students of color, and/or first-generation students.
NCAN’s Benchmarking Project compares the postsecondary outcomes of students served by NCAN member college access and success programs across the county to national benchmarks released by the National Student Clearinghouse Research Center. The results
from five rounds of that project show that NCAN members have done an excellent job closing postsecondary access disparities between member-served students and students from more affluent high schools. Offered postsecondary advising supports
that bridge the college knowledge gaps, member-served students enroll at higher rates than their peers and have enrollment rates that look like students from higher-income high schools. The data below also show that much more work remains to close
completion gaps.
The great news about NCAN member programs is they are exceedingly generous with their lessons learned. NCAN and our members are almost continuously generating new insights and resources for the field to help everyone interested in postsecondary access
and attainment do their very best to help students. (For example, check out our recent “4 for the Fall” brief and 15-month college and career readiness calendar). Stay tuned to the NCAN blog and all the rest of
our communications channels to learn more about our mission of closing equity gaps and get connected with best-in-class resources for doing so.