ByBill DeBaun, Senior Director of Data and Strategic Initiatives and Caroline Doglio, Program Associate
Reading time: Twelve minutes
The 2023-24 FAFSA completion cycle is well under way, and the start of each cycle brings hope and optimism for increases that signal students completing the form that can connect
them with financial aid. Perhaps no region nationally needs that hope and optimism to translate into actual, real-life FAFSA completions than the American West, which has lagged behind other regions in terms of completion for at least the past five cycles.
Let’s start here, before this exploratory analysis unintentionally steps on toes or hurts feelings. This blog post isn’t intended as a callout or feel-bad. It is, however, meant to draw attention to a phenomenon that is both so clear from the data and
so present over time that it cannot and should not be ignored. This blog post will examine the data on FAFSA completion in the West and propose a theory around why it lags. We hope it will spark conversation and further inquiry that will ultimately
better connect students with postsecondary pathways.
The U.S. Census’ Western region includes 13 states: Alaska, Arizona, California, Colorado, Hawaii, Idaho, Montana, Nevada, New Mexico, Oregon, Utah, Washington, and Wyoming.
During the 2022-23 cycle, these states’ average rank by percent of high school seniors completing by July 1 was 41st. Only four of these states were ranked within the top 40 (California [17th], Hawaii [21st], Wyoming [37th], and New Mexico [39th]).
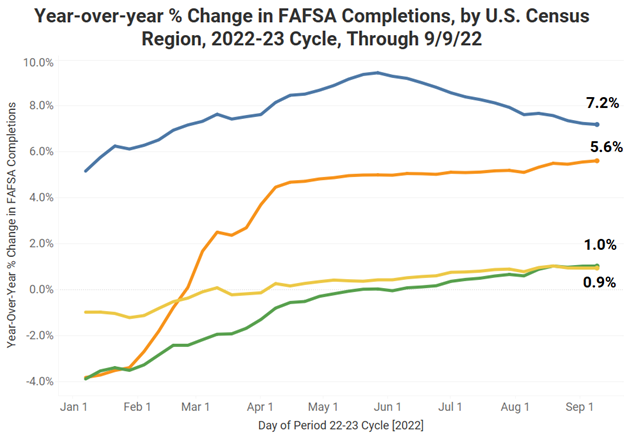
Despite the absolute performance, the 2022-23 cycle was a relative improvement for Western states. The chart below shows that these states had the second-highest year-over-year percent change increase to FAFSA completions, 5.6%, which was over the national
average of about 4.5%. The Southern region (+7.2%) was the only one to outpace the Western by year-over-year change.
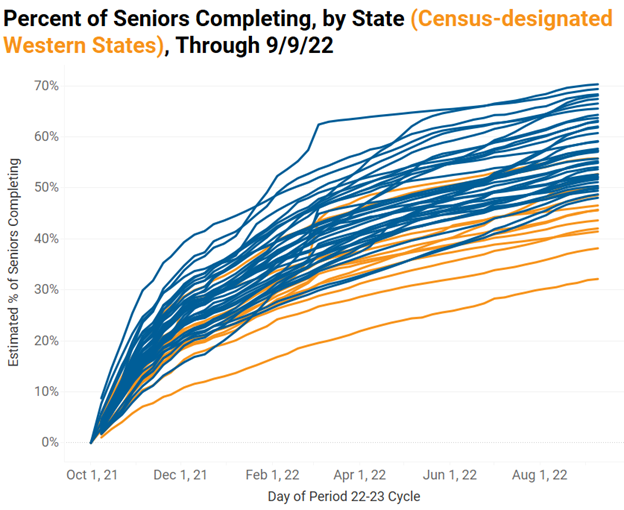
Still, even with that improvement, the concentration of Western states (in orange) at the bottom of the next chart is clear. (Sorry to California and Hawaii, whose relatively much stronger performances get gobbled up in the sea of NCAN blue.)
Unfortunately, the 2022-23 cycle was not an anomaly. Looking at the past five FAFSA completion cycles dating back to 2018-19 (representing the high school classes of 2018 through 2022), just three Western states (California, Hawaii, and New Mexico) averaged
a finish within the top 40 states by percent of seniors completing by about June 30. One unfortunate trend visible in the table below is that Alaska, Arizona, Colorado, Utah, Washington, and Wyoming remained steadily in the bottom ten states by this
metric.
State Ranks by Percent of High School Seniors Completing by About June 30, 2018-19 to 2022-23 Cycles
State
2018-19
2019-20
2020-21
2021-22
2022-23
Average
Alaska
50
51
51
51
51
51
Arizona
51
48
48
48
49
49
California
30
25
20
27
17
24
Colorado
47
47
47
47
45
47
Hawaii
18
21
19
20
21
20
Idaho
44
46
46
46
47
46
Montana
35
43
45
44
41
42
Nevada
45
41
40
41
46
43
New Mexico
41
35
35
35
39
37
Oregon
39
44
42
45
42
42
Utah
51
50
50
50
50
50
Washington
48
49
49
49
48
49
Wyoming
46
45
43
40
37
42
Those are the facts as have them regarding FAFSA completion. From here on, fair warning, there’s a fair bit of editorializing. These opinions are largely those of the writers and don’t necessarily reflect NCAN’s official views.
The baffling thing about the trend described above is that it’s hardly as though the Western states are monolithic. These states are diverse in terms of geography, population, politics, policy, and programming. Despite this, their FAFSA completion outcomes
are tightly packed in the bottom of the FAFSA completion rankings. So, is there something we can point to that is driving these outcomes in the Western region of the United States?
Brain Drain, Inertia, and Generational College-Going?
We often write about the association between FAFSA completion and enrollment, in that order, because one tends to precede the other. But let’s not get the order of operation wrong. It seems unlikely that completing the FAFSA is what is causing enrollment
(though we don’t have good research on the causality here). We generally think of completing the FAFSA as signaling intent to enroll, or at least interest in enrolling. How many students who hadn’t intended to enroll are completing the FAFSA (e.g.,
because of universal FAFSA policies), seeing the aid they would receive, and then deciding, “actually, yes, college is for me”? Some, maybe, but probably not most.
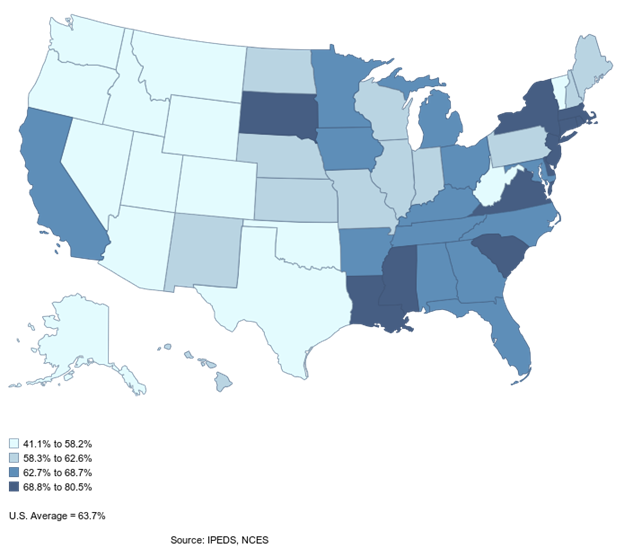
Given that, in the Western states, it seems most plausible that it’s a lack of demand for postsecondary education that is depressing FAFSA completion. Western states have relatively low immediate college-going rates of high school graduates.
The three states who have averaged a top 40 finish over the past five years by FAFSA completion (California, Hawaii, and New Mexico) also have higher immediate postsecondary enrollment rates. If a smaller percentage of students in a state matriculate
to college, states wind up with less “home-grown” postsecondary attainment. This in turn can slow the inertia that comes with continuing-generation college-going. Put plainly: students whose parents went to college are more likely to go to and complete
college themselves while first-generation students are less likely to do both these things.
College-Going Rates of High School Graduates - Directly from High School: Main - 2018
Let’s shift for a sidebar about the concept of brain drain.
Back in 2019, Republicans on the U.S. Congress’ Joint Economic Committee published “Losing Our Minds: Brain Drain across the United States,” which considered “major shifts in geographic mobility patterns among its highly-educated citizens” over the last 50 years using U.S. Census data. The brief finds that “brain drain (and brain gain) states tend to fall along regional lines, although
there are a number of exceptions to this general rule” and “provides evidence that highly-educated adults flowing to dynamic states with major metropolitan areas are, to a significant extent, leaving behind more rural and post-industrial states.”
The brief calculates both absolute and relative brain drain by considering “stayers” and “leavers.” “Stayers” are “adults born in a given state depending on whether they were still living in the state between the ages of 31 and 40” while “leavers” are
adults in that age range who were living in a different state. Meanwhile those who moved into a given state are “entrants.”
Absolute, or gross, brain drain is calculated by “subtracting the percent of ‘stayers’ who are highly educated from the percent of ‘leavers’ who are highly educated. If this difference is positive, the state has experienced gross brain drain—people who
moved out were more highly educated than those who remained in the state.” Conversely, a negative score indicates those who stayed in a state were more highly educated than those who departed.
Net brain drain is calculated by subtracting the percent of highly-educated “entrants” from the percent of highly-educated “leavers.” The brief notes that, “A positive score indicates that those who left the state are better educated than those who moved
in, meaning that the state has experienced net brain drain.”
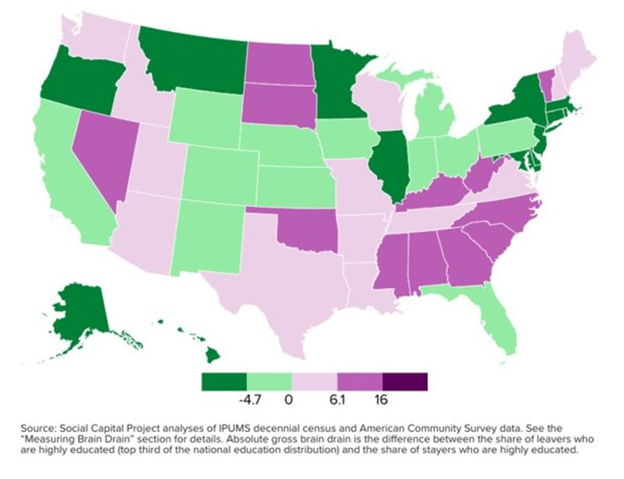
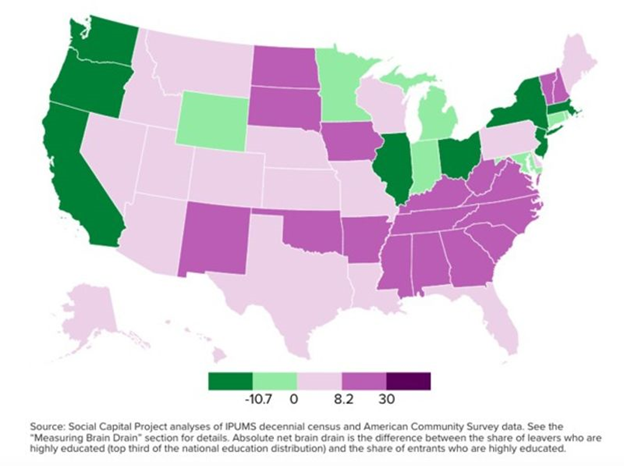
For the Western states, gross brain drain from 1970 to 2017 is a mixed bag, as the image below shows:
Five of the Western states experienced gross brain drain over this period, meaning that more of their highly-educated adults left than stayed.
Considering net brain drain over the same period shows a slightly different story:
Eight Western states experienced net brain drain over this period, even accounting for new entrants, while west coast states like California, Oregon, and Washington were buoyed by new entrants to end up with negative net brain drain, or a “brain gain.”
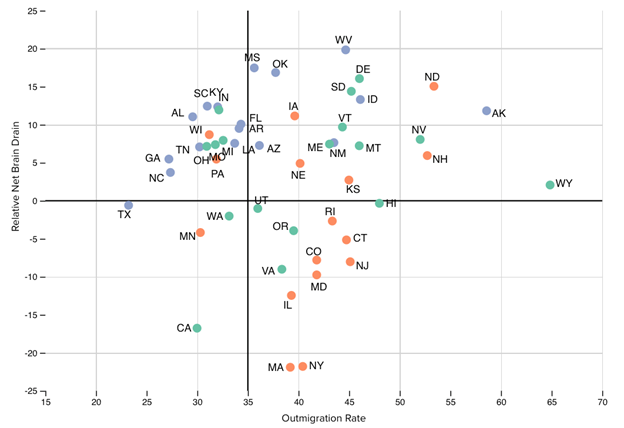
The next chart scatters the states according to their relative net brain drain (the difference between the share of highly-educated leavers and the percentage of highly-educated entrants) and their outmigration rate (the percentage of residents who leave
the state).
Seven of the 13 Western states are in that top right quadrant where there’s both a lot of brain drain and a lot of outmigration. So, if we have states where large percentages of highly-educated citizenry are leaving, that suggests that many of those who
stay will be less likely to have pursued higher education. We know that children of those parents will be more likely to be first-generation.
Data about first-generation students shows they tend to have lower educational expectations for themselves and less likely to have plans for taking the ACT and SAT in high school (figure three in the link above) compared to continuing-generation students.
For those first-generation students who do enroll in college, they’re more likely to enroll in less selective institutions (figure four), to have had that enrollment delayed, and to stop out (both figure five).
Maybe what the Western states are experiencing, then, is a cycle of more highly-educated students, where they be first- or continuing-generation, leaving the state while those who remain are more likely to have less postsecondary education and consequently
to have children who are still first-generation, with the attendant headwinds described above.
Whatever the cause of the FAFSA completion and enrollment challenges, we do see Western states’ programs and policies responding to them. This could be a whole other blog post, but it surely isn’t for lack of trying to increase that postsecondary demand
in the Western states. Organizations (and NCAN members) like the Idaho State Board of Education, Education Forward Arizona,
and the Washington Student Achievement Council, among many others across Western states, have poured lots of resources and time into driving FAFSA completions and improving college and career readiness
outcomes in their respective states.
Unfortunately, these organizations continue to face considerable headwinds, as demonstrated in both the FAFSA completion and enrollment data. Perhaps these organizations’ efforts, new tools like the Otterbot and Ask Benji chatbot, and policies like universal FAFSA (in California and to some extent Colorado) and tuition-free college (in New Mexico) will turn the tide. As we wait and see, NCAN will continue to monitor the FAFSA completion and postsecondary enrollment rates. Stay tuned.
Have thoughts about Western states’ FAFSA completion and college and career readiness efforts? A burning theory of your own to share? We’d love to talk. Thanks for reading!