By Bill DeBaun, Senior Director of Data and Strategic Services
Reading time: Two minutes
Note: NSCRC uses the words "minority" and "low-income" in ways that is inconsistent with NCAN's policies. However, for clarity sake, we have chosen to use these words in this article.
The high school class of 2022 generally enrolled in college at higher rates than the class of 2021, but outcomes were still very inequitable according to high school income levels and demographic composition. This is the main finding of the National Student
Clearinghouse Research Center’s (NSCRC) High School Benchmarks 2023 report, released today.
The report offers some encouraging news: “Graduates from high school serving the most disadvantaged students are now showing signs of recovery from the [COVID-19] pandemic-related enrollment declines, with students from high poverty and low-income high
schools having the largest increases in immediate postsecondary enrollment (+2.7% over the 2021 class).”
The report examines immediate enrollment for the high school class of 2022, first-year persistence for the class of 2020, and six-year completion outcomes for the class of 2016, as well as enrollment by major, and completions for STEM majors.
Before diving into the outcomes, it’s important to understand how the NSCRC categorizes high schools. For the income categories, high poverty high schools are those where at least 75% of students are eligible for free- or reduced-price
lunch. From there, low-income high schools have at least a 50% eligibility rate, higher income high schools have below a 50% eligibility rate, and low poverty schools have a less than 25% eligibility
rate. For the minority levels categories, high minority high schools have at least 40% Black or Latino/a students, while low minority high schools have less than 40% of these students.
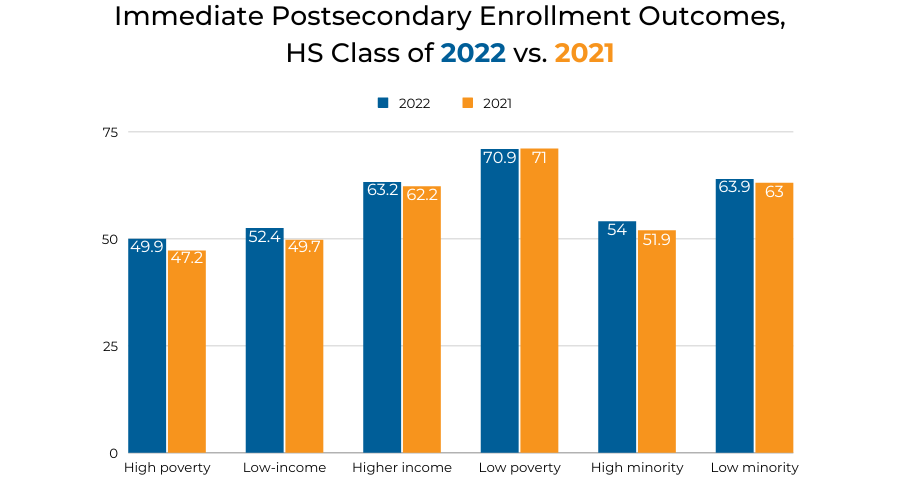
Despite the enrollment rate gains from low income and high minority high schools for the class of 2022, significant gaps remain. The chart below shows students from higher income high schools enrolling immediately 11% more than their counterparts.
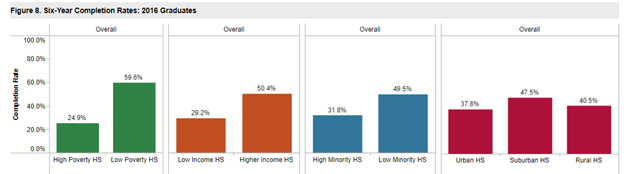
The completion rate chart for the class of 2016 paints a starkly more inequitable picture. Less than 30% of students from the class of 2016 who attended low-income high schools completed a degree or certificate within six years compared
to 50.4% of students from higher income high schools. The chart below reveals the outcomes for high schools by other categories.
The NSCRC’s High School Benchmarks series has long been one of the best resources for understanding the postsecondary outcomes of entire cohorts of graduating seniors. This report is one National College Attainment Network (NCAN) members should both bookmark
and, if they aren’t already a K-12 district or school, be sharing with their K-12 partners. These comparisons of outcomes can put a school’s own performance into some context and make the case for increasing focus on college and career readiness.
NCAN will continue to dive into these results over the next few weeks and share additional insights gleaned through Success Digest and on our blog.