By Bill DeBaun, Senior Director of Data and Strategic Initiatives
Reading time: Eight minutes
Note: This article was originally post on November 27, 2023. Subsequently, the author realized that some of the original charts focus on all school leader respondents at all levels, not just those from high schools. In most cases, the difference between all respondents and high school respondents is negligible, but charts have been replaced or added as noted below. The author regrets any inconvenience or confusion and the mistakes are his alone. Have questions or concerns? Email debaunb@ncan.org.
New nationally-representative survey data of school leaders provides insight into how they, and likely by extension their schools, use college-going milestone and postsecondary outcome data, and the results are by equal measure troubling and illuminating.
The data comes from the RAND Corporation’s American Mathematics Educator Study (AMES), but don’t let the name fool you because the survey, administered spring 2023, also collects data from principals and covers topics like data-informed improvement, school-community collaboration, student access and opportunity, and supporting
students' future careers (disclosure: the author is an advisor for the AMES Survey).
You, yes you, can access both the AMES data and data from many other surveys, for free via the Bento platform. It’s a valuable resource of high-quality survey data covering all
kinds of topics.
Here’s eight things the AMES data tell us:
1. Too many high school leaders do not have electronic access to data related to postsecondary outcomes or milestones.
(This item has been updated to reflect high school respondents only.)
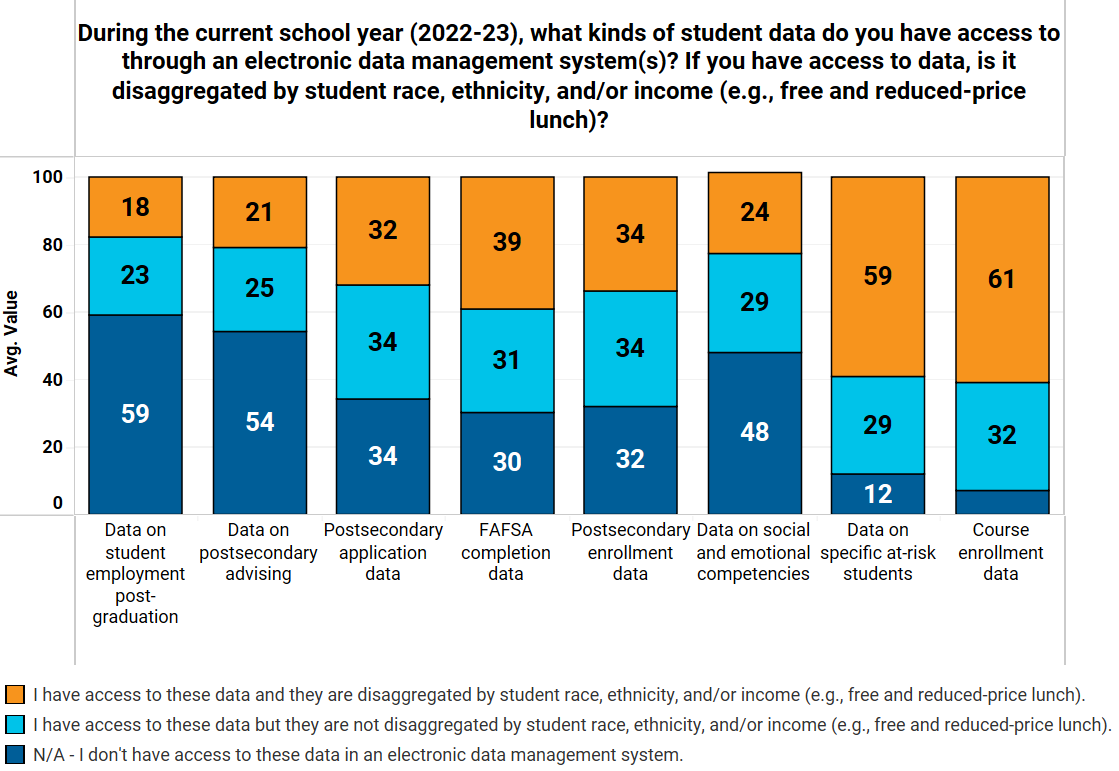
About a third of school leaders said they didn’t have electronic access to postsecondary application, FAFSA completion, or postsecondary enrollment data. Maybe they’ve got access to these data in paper or outside of an electronic data management
system, maybe not. Still, 30% or more of school leaders saying they don’t have postsecondary enrollment data at all, let alone in a disaggregated form, doesn’t bode well for leaders and schools understanding where students are matriculating and how
they do when they get there. Even more concerning is that more than half (54%) of high school respondents said they did not have electronic access to postsecondary advising data. As a field, we would do well to be finding ways to drive these percentages down.
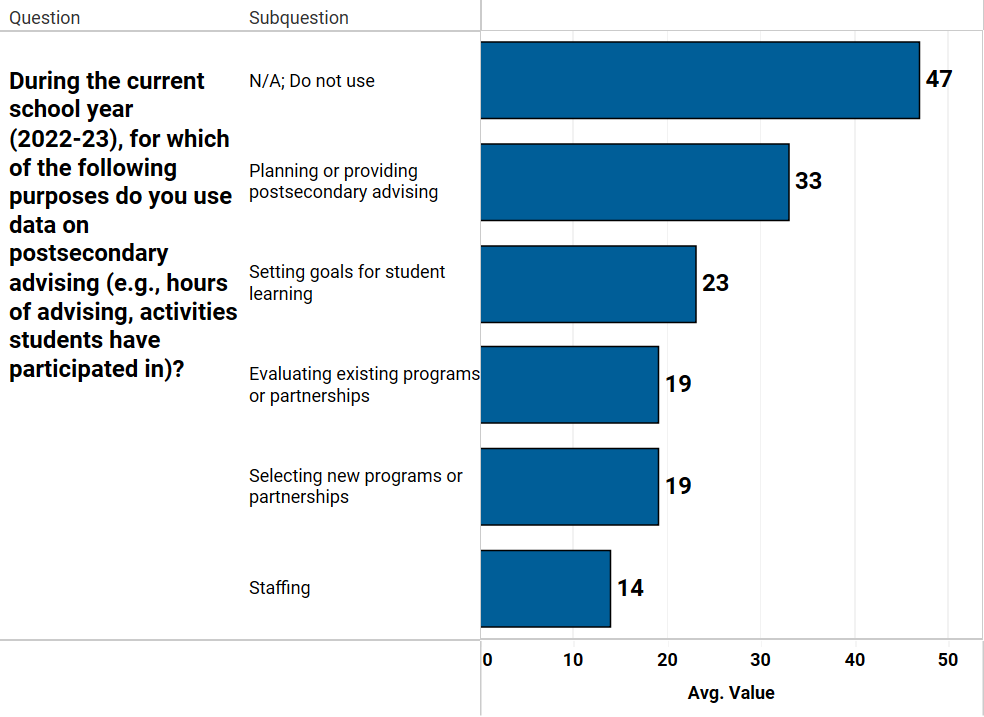
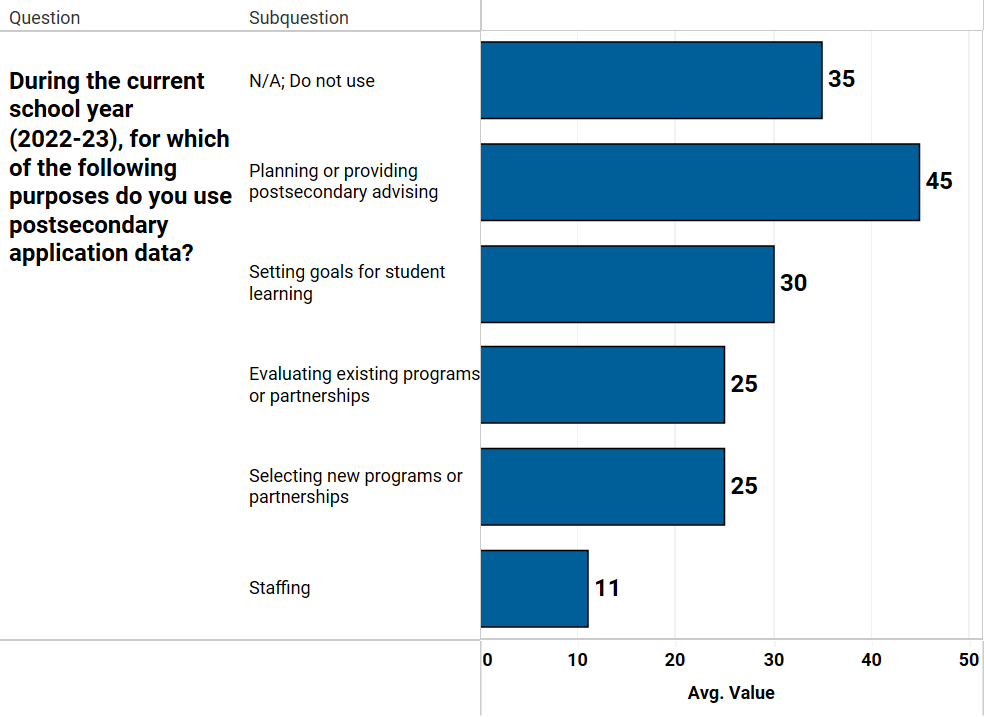
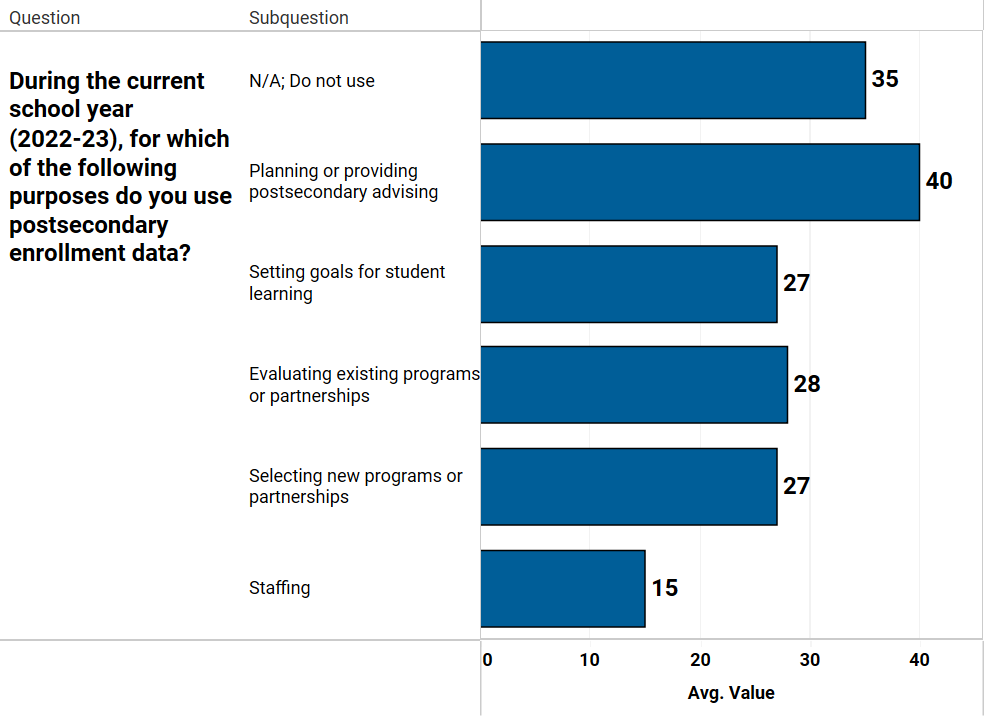
2. More than 30% of school leaders say they “do not use” data on postsecondary advising, postsecondary application, and postsecondary enrollment data.
(This item has been updated to reflect high school respondents only.)
Perhaps we shouldn’t be surprised given the previous chart. If school leaders don’t have access to these data points in an electronic data management system, then is it realistic that they would be using them (I guess they’re not actually using the data
on paper…)? The next three charts show that 47%, 35%, and 35% of school leaders did not use data on postsecondary advising, applications, or enrollment, respectively, during the 2022-23 academic year. This does mean more than half of school leaders are using this data, but these percentages are nothing to hand wave away. Fortunately, "planning or providing postsecondary advising" is the most prominent actual use of these data. This item definitely shifted after filtering to just high school leaders; prior to doing so the "do not use" figures were upward of 60%, which makes sense when we include elementary and middle school leaders.
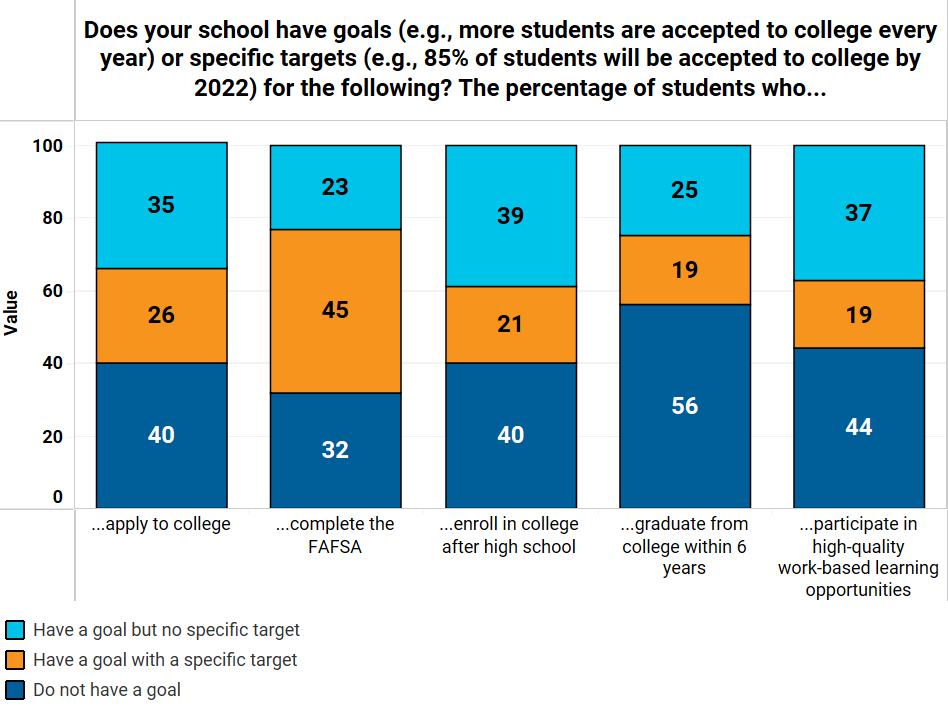
3. Schools are twice as likely to have goals with specific targets for FAFSA completion than they are to have such a goal for postsecondary enrollment.
(This item has been updated to reflect high school respondents only.)
This next one is a little more encouraging. More than half of school leaders reported having a school-level goal for FAFSA completion, applying to college, enrolling in college, and participating in high-quality work-based learning opportunities. Just
under less than half of schools had a goal for graduating college within six years (44% actually seems surprisingly high to me). FAFSA completion (45%) is by far the outcome with the highest percent of schools with both goals and specific targets;
it doubles up enrollment (21%) and nearly college application (26%) goals. This is likely because schools, and school leaders, see FAFSA completion as more within their locus of control, especially since this happens during senior year while they
don’t receive data on enrollment until after a graduating class has left the building.
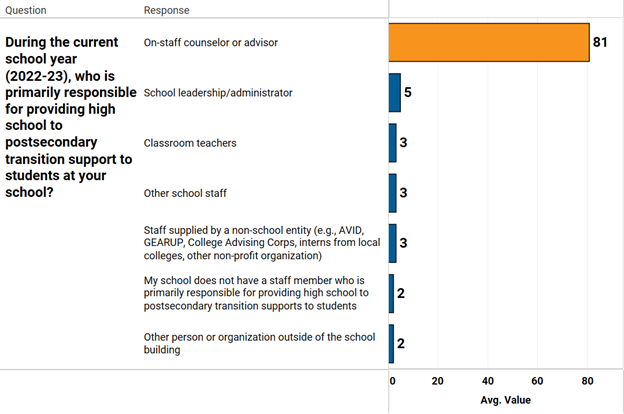
4. School counselors are bearing an overwhelming amount of the brunt of postsecondary advising.
The next two charts show how how much of the responsibility for postsecondary advising with high schools is falling solely on school counselors and advisors. First, we see that on-staff counselors or advisors are “primarily responsible” for providing
high school to postsecondary transition support at 81% of respondents’ schools. The question does ask about “primarily responsible,” so maybe this isn’t all that surprising. An additional question that would be interesting would be which of these
other stakeholders are also involved and to what degree.
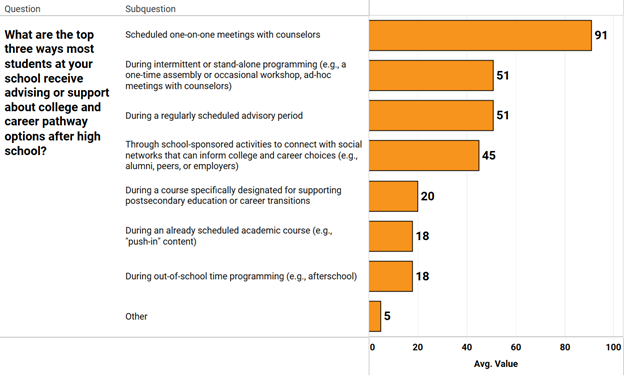
Still, when we combine the finding above with the next one, it points to this concentration of postsecondary advising responsibility on school counselors. Asked what the top three ways students received advising or support for college and career advising,
91% of school leaders reported scheduled one-on-one meetings with counselors or advisors. The next highest activities were 40 percentage points less prevalent. The National College Attainment Network (NCAN) has written before about how to
make better use of advisory periods, and it’s encouraging to see about half of school leaders reporting their
use. Still, all of these activities, except for one-on-ones with counselors, have levels that could and should rise.
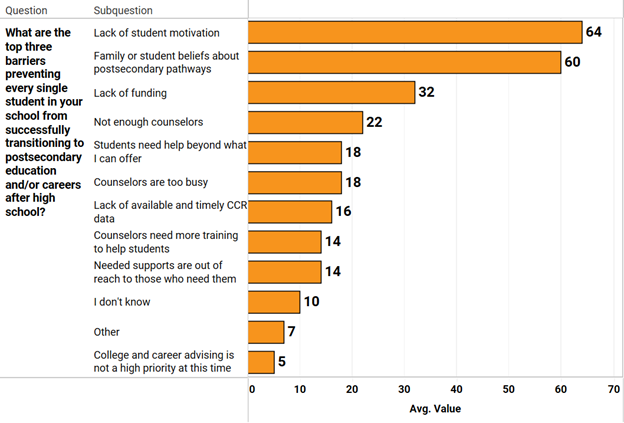
5. The barriers to postsecondary transition that school leaders report read a little like blaming students and families for the supports they’re not receiving.
Asked to name the top three barriers preventing every single student from making a postsecondary transition, two stand out and not in a good way. School leaders reported a lack of student motivation (64%) and family or student beliefs about postsecondary
pathways (60%) as the top barriers for making postsecondary transitions. The next highest barrier, a lack of funding, came in at only 32%. Schools and the leaders and professionals working within them are constantly being asked to do more with less;
secondary schools have long been a challenging environment, and that hasn’t changed in recent years.
Still, it’s a little galling to pin the lack of postsecondary transitions on students and families. There’s something very discomfiting about school leaders saying these other barriers are less of a problem than student motivation and family
beliefs. That’s because there not being enough counselors, counselors needing more training, and needed supports being out of reach for those who need them are often contributorsandprecursors to student motivation and
family beliefs. No doubt student motivation and family beliefs are important, but the relative priority in this chart shows some school leaders might have the causality backward.
This chart should be a call to action: there’s a real need to dig in with students and families, to do some work changing hearts and minds, and to help students get motivated.
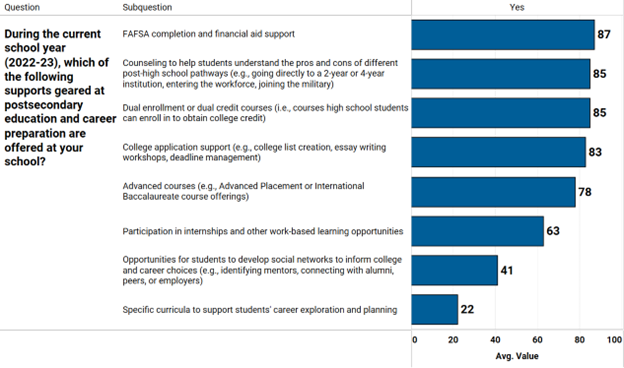
6. Most students are offered a core of college advising services, but career services are relatively more scarce.
Broadly speaking, the previous two charts taken together indicate high schools are providing a pretty standard core of postsecondary education and career preparation services, and a broad swath of student profiles get access to both kinds of services.
FAFSA completion, postsecondary pathways counseling, access to dual enrollment or dual credit courses, and college application support were all identified by more than 80% of leaders as provisioned by their schools. Access to advanced coursework fell
just under that 80% mark, and the finding that dual credit is more common than in-school advanced coursework in a nationally representative study is another surprising finding. Access to career-related services like internships, work-based learning,
and career exploration and planning were relatively much less common.
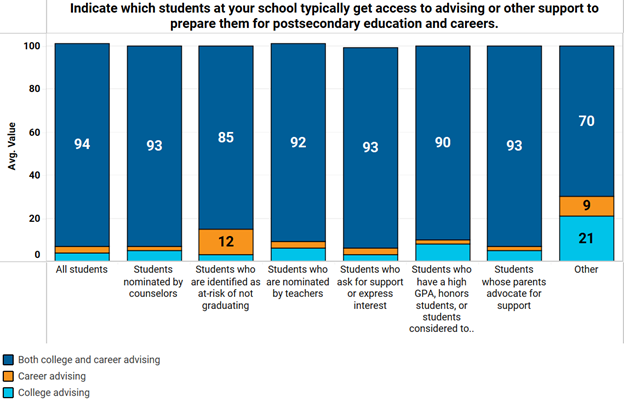
The second chart shows that 94% of school leaders said all students have access to both college and career services, and that figure is approximately the same for students nominated by teachers and counselors, students who self-identify, etc. The real
blip in this chart is for students who are identified as at-risk of not graduating; these students’ are three to four times likelier to only receive career services.
Of course it's worth calling out that "are offered" and "have access to" aren't synonymous with "receiving." These charts don't tell us very much about the delivery, for that you've got to jump back up to #4 where we see, again, that counselors are the
main delivery mechanism. There's a bottleneck there.
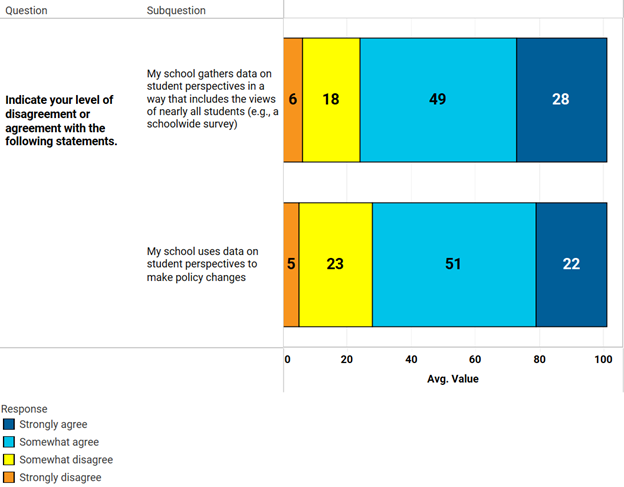
7. Most school leaders say they are collecting students’ perspectives and using them to make policy changes.
This finding is another one-two punch. More than three-quarters of school leaders (77%) somewhat or strongly agree that they are collecting data on student perspectives the “include the views of nearly all students.” A schoolwide survey is the example
of this data collection. Even more encouraging is that just under three-quarters of these school leaders (73%) also say they use the findings from these students’ perspectives to make policy changes in their schools.
NCAN has recently considered how students’ experiences shape those students’ actions and outcomes, and is
continuing to do so. We sketched out five principles of what states, districts, and schools should be doing in this area:
Strive for equity in both experiences and student outcomes and uses multiple measures to track student progress.
Provide students with information and opportunities related to a wide breadth of college and career pathways, starting in middle school.
Believe in and support all students, not just those students historically on-track for matriculation to a college or university.
Deliver advising that is aligned with each student’s interests, aspirations, and aptitudes.
Collect, analyze, report, and share data critical to college and career pathways and use that data to drive their student services and supports.
Given these principles, this finding from AMES that school leaders broadly report collecting and using students’ perspectives is encouraging. Watch this space for more!
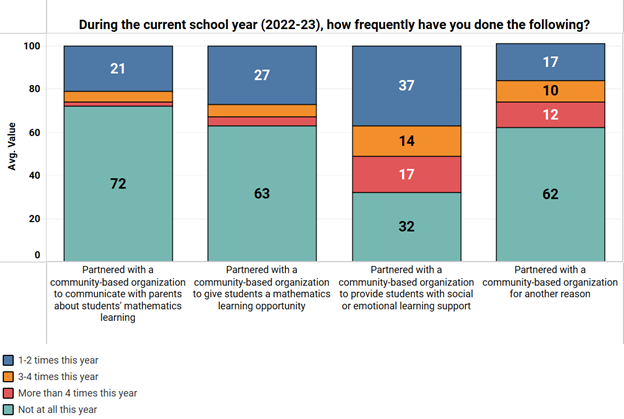
8. There’s a lot of opportunity to grow school-community partnerships.
Rounding into home, here's another item that’s near and dear to our hearts here at NCAN: partnership between schools and community-based organizations. The question asks about four kinds of partnerships: communicating with parents about students’ mathematics
learning, communicating with students about a mathematics learning opportunity (remember this is a math education survey!), providing students with social or emotional learning support, and the catch-all partnering for “another reason.”
School leaders were relatively more likely to report having partnered externally for socioemotional support (68% partnered in this way at least once), but nearly the inverse was true for partnering with CBOs for “another reason.” More than 60% of school
leaders said they did not partner with a CBO for “another reason” in the past academic year. Not great, Bob!
NCAN has many great examples of school-CBO partnerships. Here are just a few:
So to the 60% of school leaders who haven’t partnered with a CBO yet, reach out to NCAN (or to your neighbors) and say hello. You never know what might spring out of that meeting that could better support students’ college and career pathways.
The RAND AMES data are a real wealth of information on a wide variety of topics. The survey data above indicate opportunities to
grow for many schools across the county, especially in the areas of accessing and using data. NCAN will continue to explore and report on this data. Stay tuned for future findings!
Have questions about this data and want to chat? Contact me (Bill DeBaun) at debaunb@ncan.org!